Park flyovers
These are 45-second loops that circle one landmark in a park, made to sit at the top of a park page. The shape of the land comes from USGS lidar and the ground color from USDA aerial photos. The light, the camera path and the animals are our choices, and the notes below say which is which. Select a picture to play its loop.
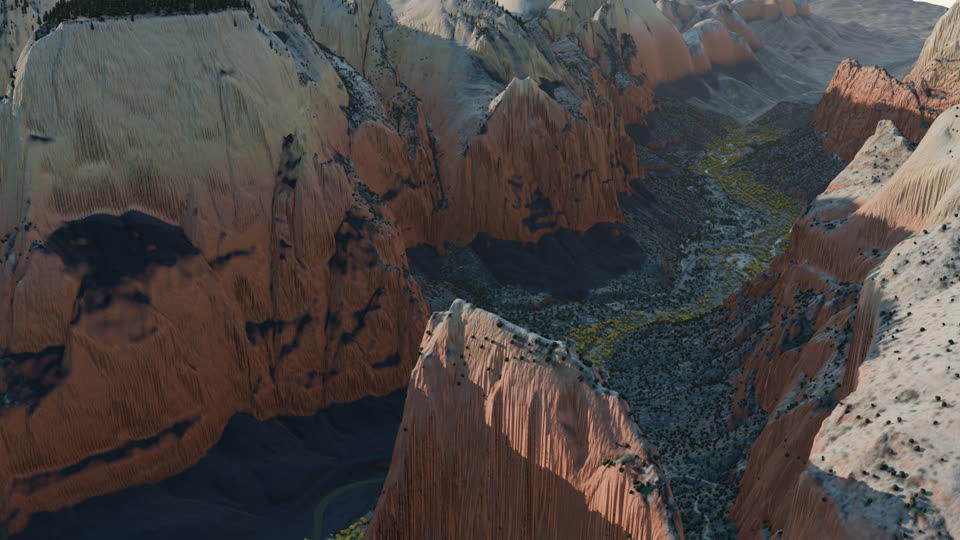
Angels Landing, Zion National Park
The sun has just cleared the east rim, so Angels Landing and the peaks are lit while the canyon floor is still in shadow. The cottonwoods along the Virgin River are at their autumn gold. Two California condors circle the summit, where condors nest and are often seen.
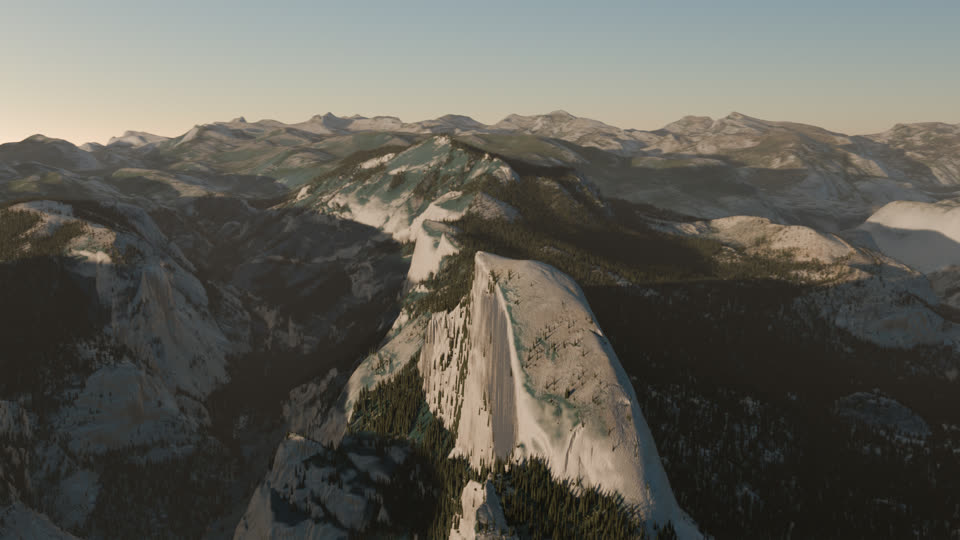
Half Dome, Yosemite National Park
About half an hour before a midsummer sunset, the sun sits square to the northwest face, so the wall catches the last warm light while the valley below goes into shadow. The loop passes over the back of the dome and swings out to the west to face the wall, the side Ansel Adams photographed from the Diving Board.
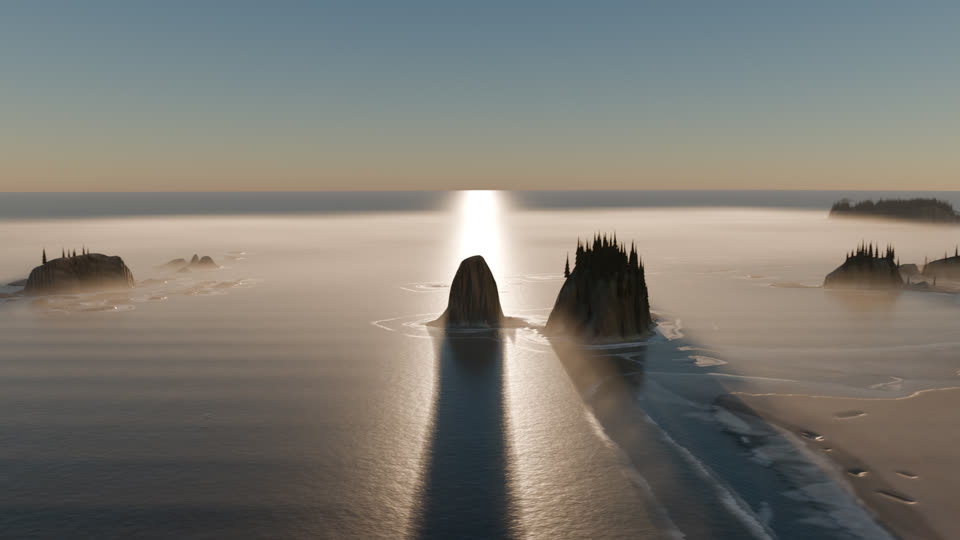
Crying Lady Rock, Olympic National Park
In midsummer the sun sets far enough north to drop behind the sea stacks off Second Beach. A low fog sits on the water and the tide is out. A bald eagle and a few gulls circle the stacks, which belong to a national wildlife refuge.
How a loop is made
Each one starts with research on the place. We look at how photographers have framed the landmark, which side they shoot it from and in what season, and pick one date and time when the light suits that view. A sun position calculation turns that moment into the direction and height of the light.
The terrain is USGS 3DEP lidar elevation at one meter, which the agency makes from airborne laser surveys. The ground color is USDA NAIP aerial imagery. Lidar stops at the shoreline, so on the coast the offshore rocks and the seafloor come from NOAA's coastal elevation model. Trees stand where the aerial photos show a crown, one tree for each.
The camera flies a teardrop-shaped loop. It passes close to the landmark on one side and pulls back on the other to show the setting, and it climbs wherever a ridge would block the view. The scenes were rendered in Blender on a laptop. A full loop takes between five and nine hours.
What is measured and what is not
The shape of the land and the color of the ground are measured. Photos taken from above show very little of a cliff face, so the color on steep walls is a scanned rock texture tinted to follow the rock layers. The light, haze, fog, surf and birds are added to match a real date and place. The animals are species that live there, shown at their real size.
We are testing these loops as covers for park pages on Park Atlas.
Sources: USGS 3D Elevation Program lidar (Zion 2016, Yosemite 2019, Olympic Peninsula 2017); USDA National Agriculture Imagery Program; NOAA NCEI Continuously Updated Digital Elevation Model; rivers from OpenStreetMap contributors; rock and sand textures from Poly Haven (CC0). Rendered in Blender.