Labs
Labs is where we build small tools with public data. Most of it comes from the same government sources behind Park Atlas, Campsite Atlas and Register Atlas, so the data is already collected and checked. When a tool works well enough, it moves onto one of those sites.
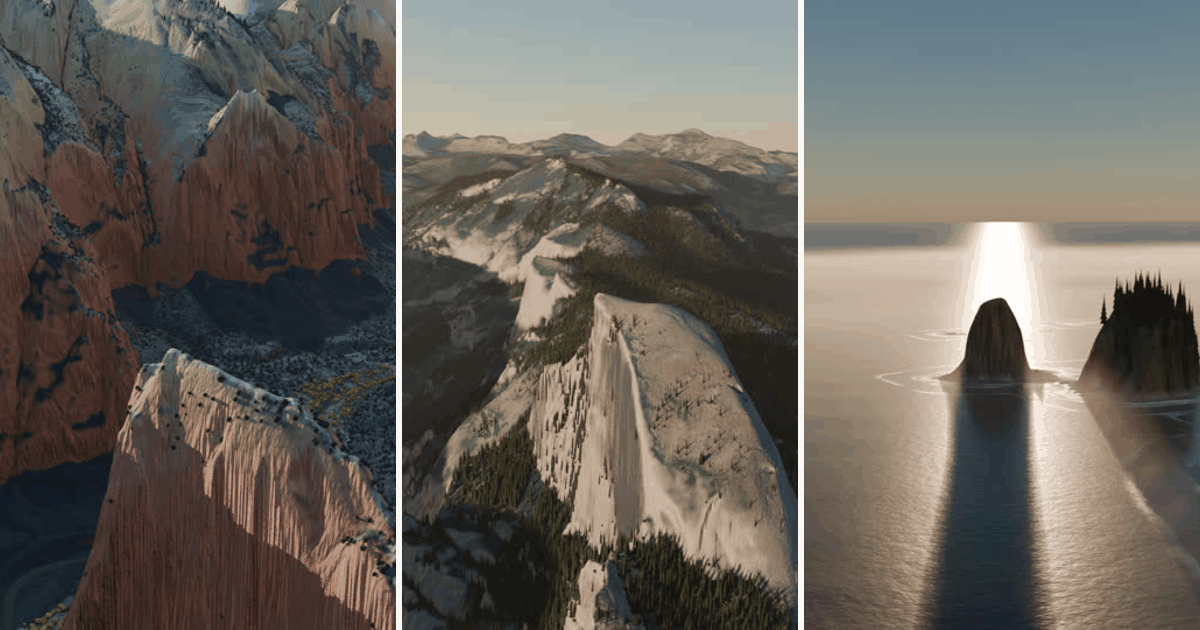
Park flyovers
Looping flights around one landmark in a park, rendered from the same elevation and aerial photo data behind our park pages. Angels Landing in Zion, Half Dome in Yosemite and Crying Lady Rock on the Olympic coast so far. A page explains how they are made.
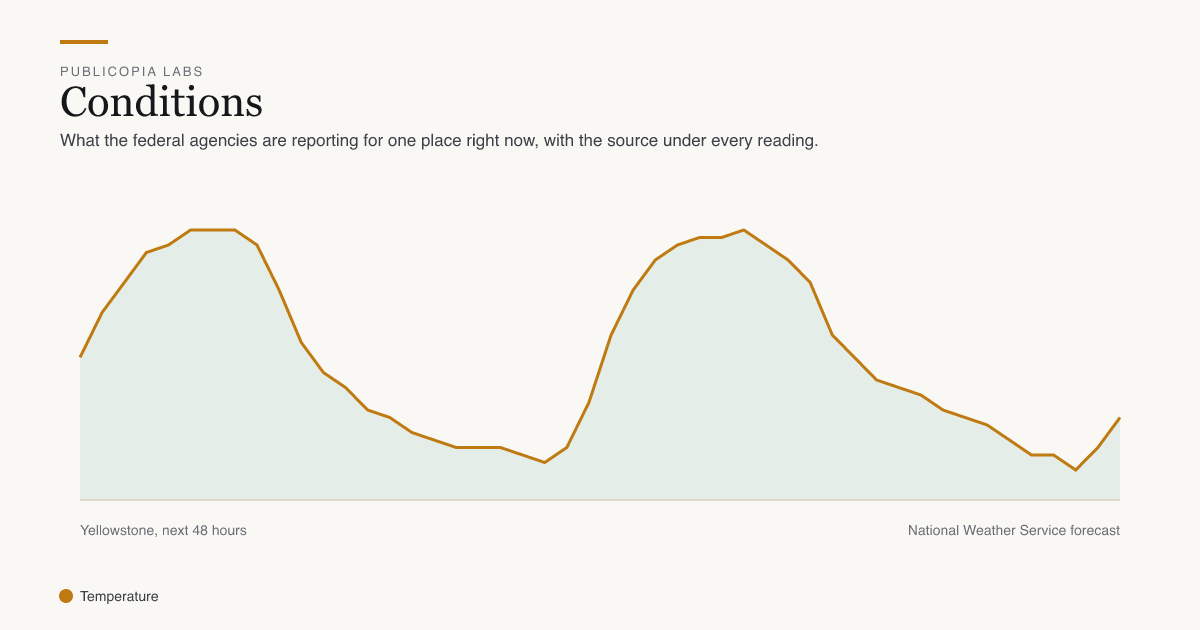
Conditions
Type a zip code or use your location to see what the federal agencies are reporting for that spot right now. It covers the forecast, alerts, air quality, smoke, nearby fires, river gauges, tides and snowpack, with the source and time under each reading.
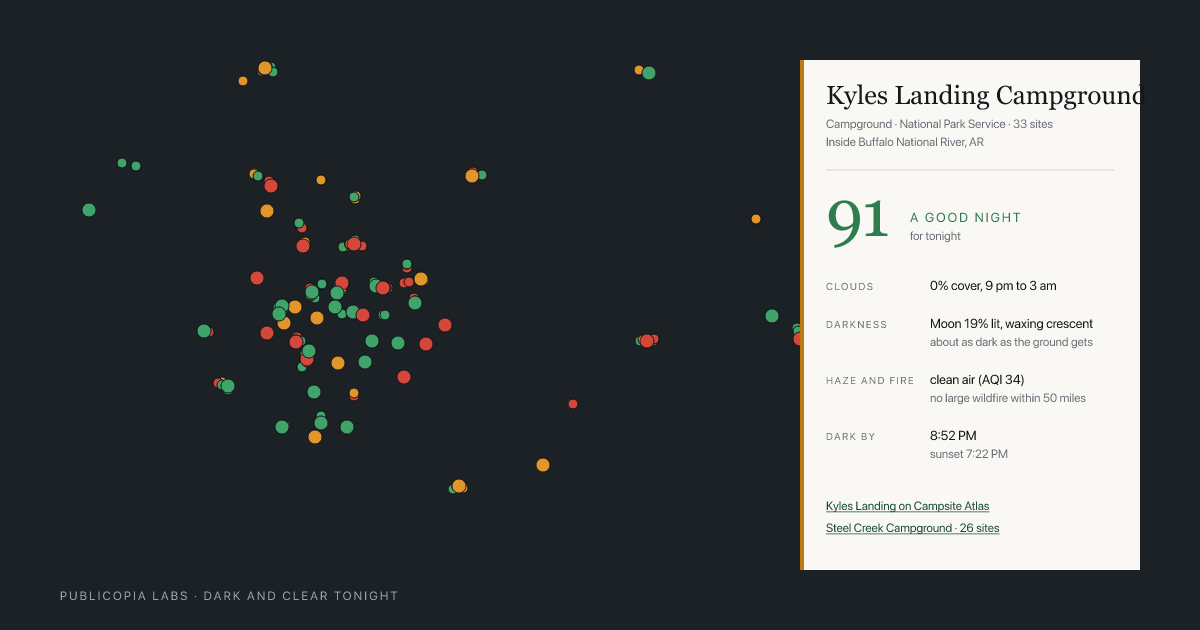
Dark and clear tonight
A score for tonight at every federal campground and park unit under a certified dark sky. The score comes from the cloud forecast, how dark the ground is, and any smoke in the air. Type a zip code to see the closest ones.
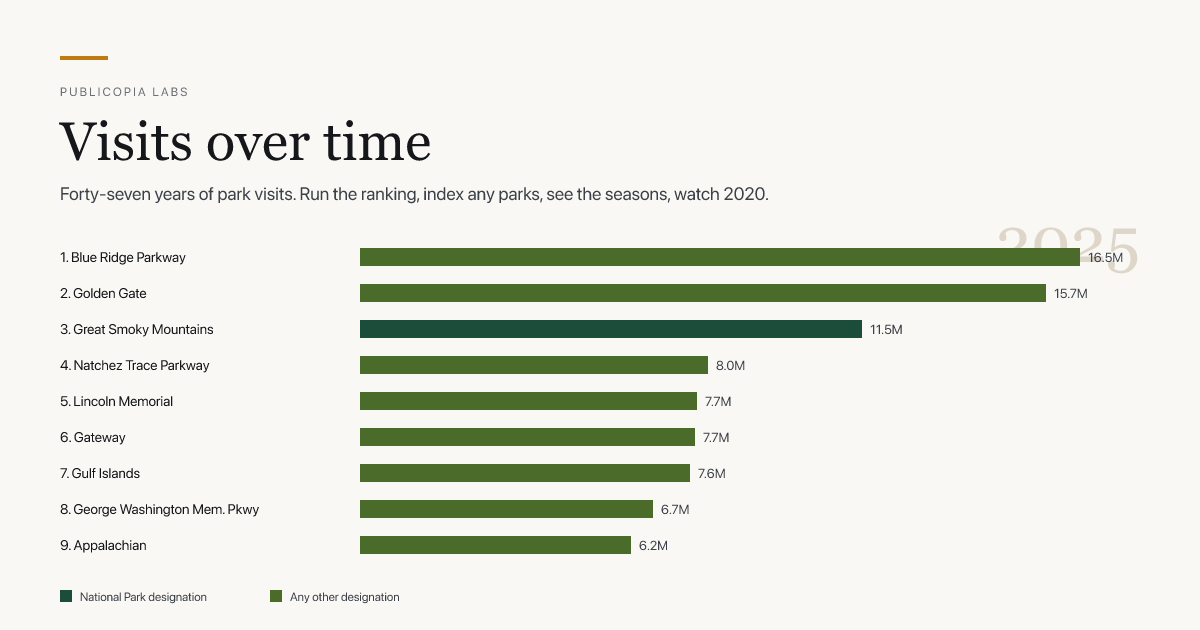
Visits over time
Park Service visit counts for every unit since 1979. You can run the ranking year by year, compare parks on one chart, look at which months a park is busy, and see how 2020 went.
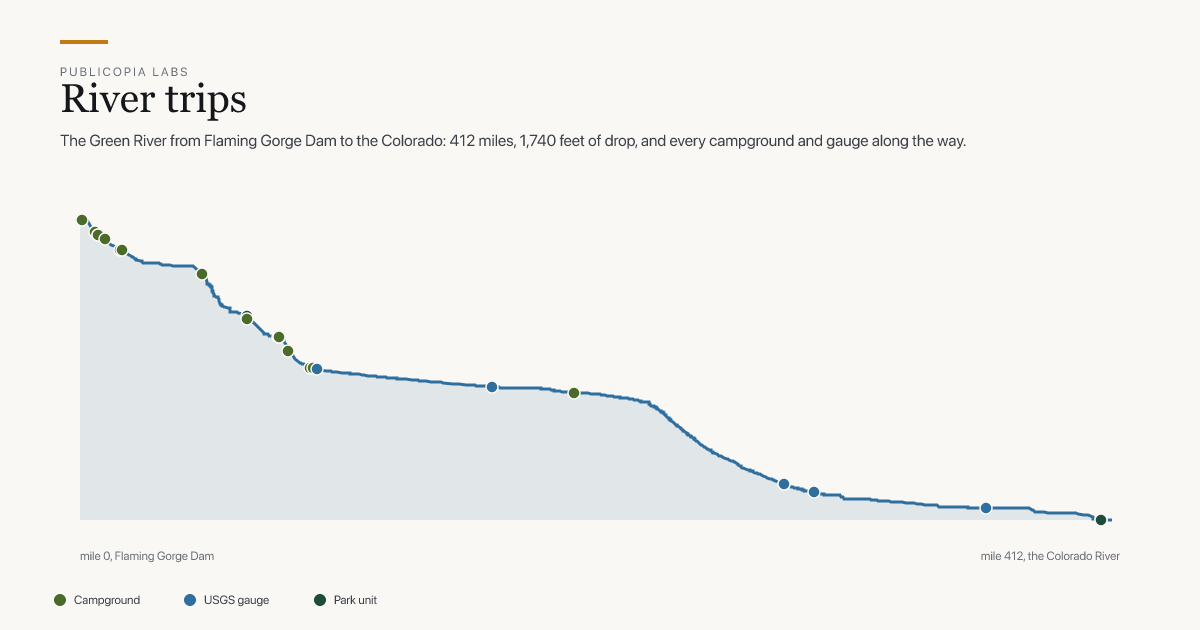
River trips
A river followed from a dam to a confluence, with the federal campgrounds, USGS gauges, towns and park units along it, the flow right now, and the drop in elevation by mile. The Green in Utah and the New in West Virginia so far.
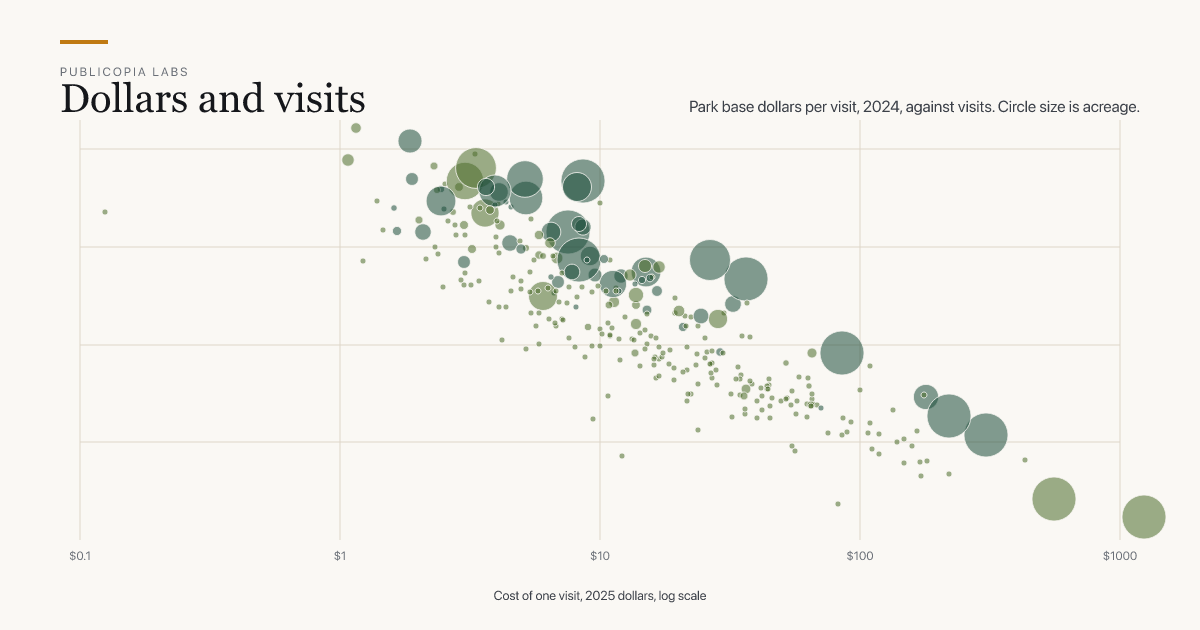
Dollars and visits
What the Park Service spends to run each park, next to how many people visited, from 2018 to 2024. The money comes from the annual budget books and is adjusted for inflation.